Description
 |
| Cause and Effect Diagram |
It is a data representation technique where the causes are broken down into further branches to reach the root cause.
It is also known as fishbone diagrams, why-why diagrams, or Ishikawa diagrams.
HOW IT WORKS
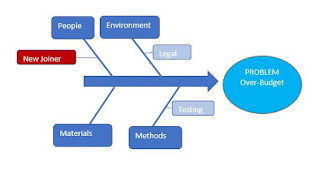
If you look at the diagram above it looks like the bone of a fish and that is why it is also known as the Fish Bone Diagram.
1. Write the problem at the head of the fish as sown in the figure.
In this case, the problem is “the project is over-budget”.
2. Identify what could be the potential categories of causes that might be resulting in the over-budget of the project. Remember – Identify the category first and then we can go to the exact cause.
3. Write each category as a bone touching the sine of the fish.
We have 4 categories of issues here.
People
Environment
Materials
Methods
4. Dive deep to find out what all people-related issues might be causing the overbudget. Similarly, identify the environment, materials, and methods-related issues in detail. Branch out the small issues under each broad category as shown in the figure.
5. In this example, let us say you found that a new joiner under the category of people-related issues is the root of the problem. The person has joined recently and is not fully skilled in the special skill you need to complete the job. Take that as a separate sub-branch under the people category of causes.
Once you have found the problem, you can work on the solution like developing the skill with training.
It belongs to the tool category – Data representation
Where it is Used
Process Groups
This tool is used in the following Process Group(s) during the project management.
Executing
Monitoring & Controlling
Knowledge Areas
Project Quality Mgmt.
Activities
This technique is used while performing the following project management activities by the project manager and the team.
Manage Quality
Control Quality
Process Group | Knowledge Area | Activity |
Executing | Project Quality Mgmt. | Manage Quality |
Monitoring & Controlling | Control Quality |
Copyrights Reserved (MyPMP)
Related Posts:
- TEXT-ORIENTED FORMATS – PMP Tools and Techniques
- STAKEHOLDER ENGAGEMENT ASSESSMENT MATRIX – PMP Tools and Techniques
- SCATTER DIAGRAMS – PMP Tools and Techniques
- PROBABILITY AND IMPACT MATRIX – PMP Tools and Techniques
- MIND MAPPING – PMP Tools and Techniques
- MATRIX DIAGRAMS – PMP Tools and Techniques
- LOGICAL DATA MODEL – PMP Tools and Techniques
- HISTOGRAM – PMP Tools and Techniques
- FLOWCHARTS – PMP Tools and Techniques
- AFFINITY DIAGRAMS – PMP Tools and Techniques
- RESPONSIBILITY ASSIGNMENT MATRIX – PMP Tools and Techniques
- Data Representation – PMP Tools


