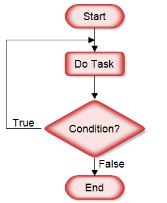
Description
Flowchart |
It is a stepwise pictorial presentation of inputs, activities, decision points, loops, and outputs.
It belongs to the tool category – Data representation
Where it is Used
Process Groups
Planning
Executing
Knowledge Areas
Project Quality Mgmt.
Activities
Plan Quality Management
Manage Quality
Process Group | Knowledge Area | Activity |
Planning | Project Quality Mgmt. | Plan Quality Management |
Executing | Manage Quality |
Copyrights Reserved (MyPMP)
Related Posts:
- TEXT-ORIENTED FORMATS – PMP Tools and Techniques
- STAKEHOLDER MAPPING – PMP Tools and Techniques
- STAKEHOLDER ENGAGEMENT ASSESSMENT MATRIX – PMP Tools and Techniques
- SCATTER DIAGRAMS – PMP Tools and Techniques
- PROBABILITY AND IMPACT MATRIX – PMP Tools and Techniques
- MIND MAPPING – PMP Tools and Techniques
- MATRIX DIAGRAMS – PMP Tools and Techniques
- LOGICAL DATA MODEL – PMP Tools and Techniques
- HISTOGRAM – PMP Tools and Techniques
- HIERARCHICAL CHARTS – PMP Tools and Techniques
- CAUSE-AND-EFFECT DIAGRAMS – PMP Tools and Techniques
- RESPONSIBILITY ASSIGNMENT MATRIX – PMP Tools and Techniques